Weighting for Non-Response
The Leicester Lifestyle survey was a postal survey of
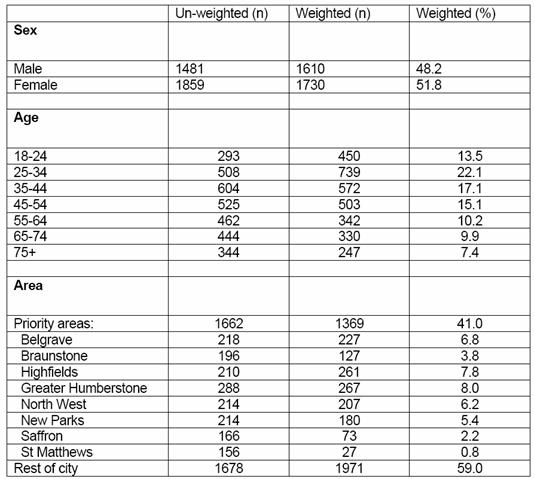
9,500 residents, 3,340 returns (38%). The table below
shows the un-weighted sample sizes for various subgroups
(column 2) – so, for example, the response of 3,340
comprised 1,481 men and 1,859 women (44% men and 56%
women). The actual population of the city comprised
48.2% men and 51.8% women. The final column in the table
below shows the results from the weighted data (with
weightings to correct for non-response) |
|
 |
Weighting for Disproportionate Sampling
In many cases in lifestyle surveys, we design our sampling scheme using
‘sampling proportionate to size’. This means that sub-groups are included in
proportion to the size of the sub-group. So, if our population had 55% women and
45% men, we would choose our sample so that 55% of residents we mail will be
women, 45% men. This is usually done by systematic sampling from a list. We
arrange the sampling frame (e.g. GP register) in gender order and by selecting
systematically from the list we effectively end up with a stratified random
sample.
By selecting every 10th person down the list, we end
up with a sample where the 2 subgroups (women and men)
are in proportion to their size in the full list. |
|
11,000 women |
Women
|
←
← select every 10th
←
← |
|
9,000 men |
Men
|
|
|
Example
If the list had 20,000 residents, 55% = 11,000 women
and 45% = 9,000 men. By ordering the list – women first,
men second – and then selecting every 10th person, we
would end up with a sample of 2,000 residents, 1,100
women and 9,000 men. |
